Print Design
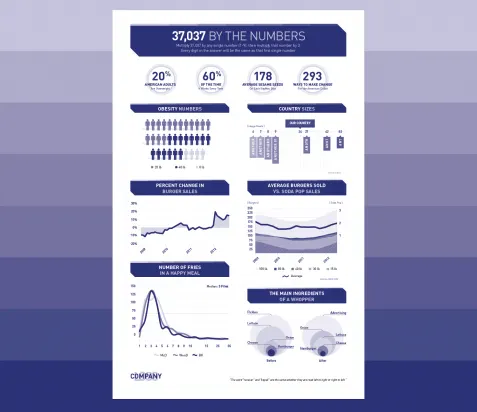
We were tasked design an infographic for a company to display their current state of operations. They wanted something nice to effectively communicated various statistics within their company to the board of directors at their year-end board meeting.
The requirements were to take various Excel data points and graphs, and better present them in a more easier way to understand.
You’ll notice that we’ve since replaced the statistics with make believe since the data presented in this infographic was not meant for the public.
The feedback from the company on our design was incredibly positive, and we were told the Board understood the data easily and was extremely happy with the outcome.
Services Used
Click on a service below to learn more: